
Research
Nutrient Cycling
Phytoplankton growth is limited multiple essential nutrients, each with their own unique sources, sinks, and cycles in the ocean.
Nitrogen cycle: Biologically available (“fixed”) nitrogen is the most important limiting nutrient throughout the low latitude ocean. Nitrogen sources and sinks are therefore critical drivers of ocean productivity and the biological pump strength. Our work has contributed to understanding the microbial dynamics and climate sensitivity of fixed nitrogen loss in anoxic “dead” zones of the water column (Deutsch et al. 2014, Science; Penn et al., 2014, GRL), and has quantified the roles of iron versus phosphorus limitation in shaping the niche of diazotrophic plankton that add new fixed nitrogen to the ocean (Weber & Deutsch 2014, PNAS).
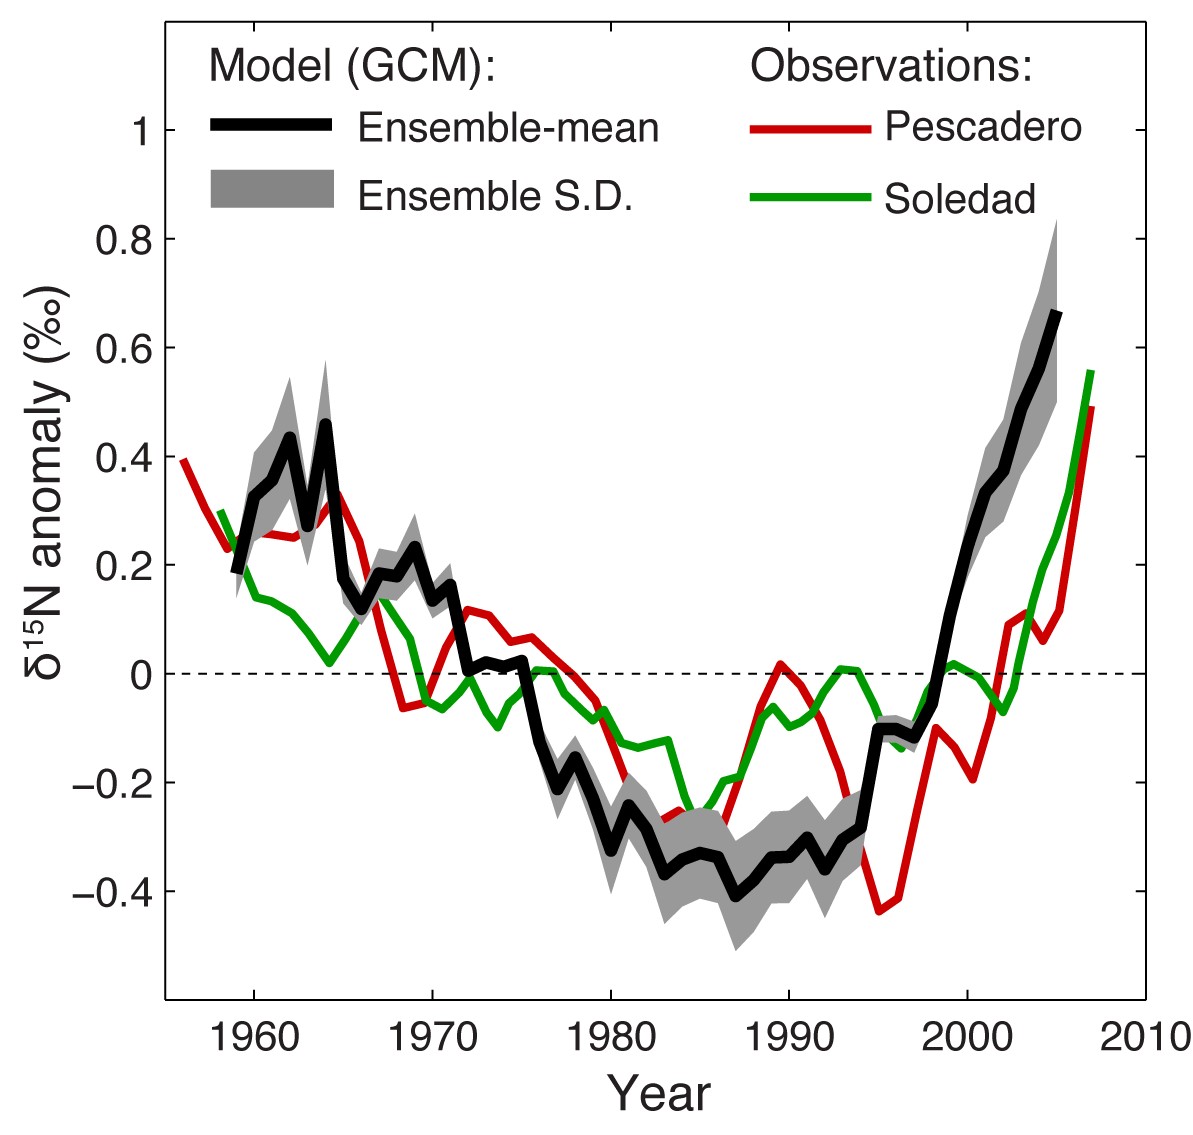
N isotope anomalies of sinking organic matter in the Eastern Tropical North Pacific over the last 50 years, as simulated in a Global Climate Model (GCM) and observed at two locations in Baja California. Adapted from Deutsch et al., 2014.
Trace metal cycles: Trace metals are increasingly recognized as essential micronutrients that limit phytoplankton growth in polar oceans and influence microbial community structure. Motivated by the wealth of data contributed by the global GEOTRACES program, we are developing data-assimilation models to quantify the sources and sinks of these metals and trace their cycling through the marine food web. This approach has been applied to identify key processes in the oceanic zinc (Zn) and aluminum cycles (Weber et al. 2018, Science; Xu & Weber 2022, GBC).
![Inverse model (lines) fit to [Zn] data (dots) in the surface Southern Ocean (top) and through the water column in the Atlantic and Pacific Oceans (bottom). A combination of surface nutrient consumption, reversible scavenging, and large-scale ocean circulation controls this distribution. Figure adapted from Weber et al., 2018.](../assets/images/nutrient-cycling-2.jpg)
Inverse model (lines) fit to [Zn] data (dots) in the surface Southern Ocean (top) and through the water column in the Atlantic and Pacific Oceans (bottom). A combination of surface nutrient consumption, reversible scavenging, and large-scale ocean circulation controls this distribution. Figure adapted from Weber et al., 2018.