
Top! And it's gone...

How would you measure a time span of less than a trillionth of a trillionth of a second (10-24 s)? That's how long top quarks are expected to live after being produced in high-energy collisions. Remarkably, although this fleeting particle was discovered more than 15 years ago and we know its mass, charge, and several other properties, no precise measurement of its lifetime existed; only upper and lower bounds. That was until Prof. Aran Garcia-Bellido and his colleagues on the DZero experiment at the Tevatron collider in Fermilab decided to measure the lifetime of the top quark.
Some subatomic particles, such as the electron and the proton, appear to be completely stable but others disintegrate into different (lighter) particles after they are produced. For example, muons produced in the upper atmosphere by cosmic rays live around a microsecond, or 10-6 seconds and decay into electrons and neutrinos. A particle's observed lifetime, or how long it lives before it decays, depends on its speed relative to the observer (us), and the inherent probability of its coupling (or decay) to lighter particles, which depends on its own mass, and how many different lighter particles it can decay to without breaking conservation laws. In general, the heavier the particle, the faster it will disintegrate. Since the top quark is the heaviest elementary particle yet discovered, we should expect its decay to be quite fast. And, indeed, the top quark is so massive (170 GeV) that it has one of the shortest lifetimes in Nature: half a yoctosecond, or 5 10-25 s. This time is so short that it is hard to imagine!
So how can particle physicists measure such an astonishingly small period of time? They measure instead a property that is easier to access: the particle's "width" Γ, which, according to the Heisenberg Uncertainty Principle, is inversely proportional to its lifetime. The width of a particle is the inherent uncertainty in the mass that the particle assumes. It has nothing to do with spatial length or width, but rather with the spread in its observed mass. If we could measure the mass of the top quark thousands of times with no experimental error, we would not get a unique value, but rather a distribution described by a mean and a width. This curve is called a Breit-Wigner or a Lorentzian, and represents the spread of measured masses of unstable particles. The width is related to how accurately we can define the mass of any particle at rest: the shorter the lifetime (the wider the curve), the less sure we can be about the value of that mass.
Besides this natural width, there is also the experimental uncertainty of the measuring apparatus to contend with. Because top quarks decay to other particles so quickly, we can only infer the existence of a top quark by measuring its decay products: the lighter particles that are stable enough to leave signatures in our detectors. By measuring the energies of these decay products, and adding them up to reconstruct the original top quark, we estimate, though imperfectly, the mass of the top quark and its experimental uncertainty. This can be seen in Fig. 1.
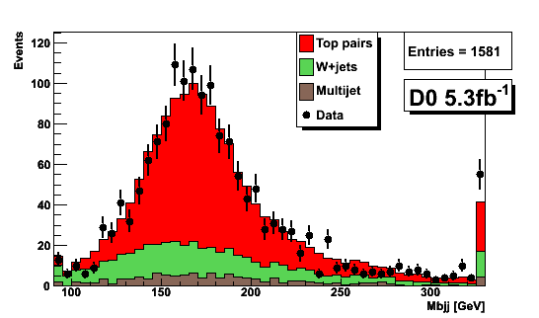
Figure 1: The reconstructed top quark mass distribution. This is the combined mass of the decay products: t→bW→bjj, where the top quark decays to a bottom quark (a partner of the top quark) and a W boson, which immediately decays to two light quarks. The top-quark mass is therefore reconstructed from "a b jet and two light jets," which are the remnants of the three quarks. The simulated signal expected for decays of top quarks is given by the red histogram, and the green and brown histograms represent the simulated background processes (amounting to less than 30% of the total). The points with error bars represent the DZero data, which agree well with the signal + background predictions. The data peaks at 170 GeV but has a broad distribution with a width of several tens of GeV, which can be attributed mainly to the experimental resolution. The last bin contains the overflow events.
Physicists from CDF, a competing experiment at the Tevatron, have also performed detailed measurements of the width of top quark based purely on the observed mass distribution. However, these measurements are limited by detector resolution, which is far greater that the expected natural width of about 1 GeV, and can only set upper bounds on the width of the top quark.
In a recently published article in Physical Review Letters, Prof. Garcia-Bellido and collaborators go around this experimental hurdle by doing an indirect extraction of the top quark width: by measuring the probability or "partial width" of the dominant decay mode of top quarks Γ(t→bW), which can be identified through the production of top quarks in a specific reaction, where a b quark and W boson fuse to produce a single top quark that subsequentially breaks up into a b quark and W boson. The total top width is obtained in this case from the ratio:
Γt= Γ(t→bW)/B(t→bW)
of the measured partial width, and the fraction of times that the t→bW decay occurs in Nature, B(t→bW), which was measured previously by DZero. The key element in the new result is that the mass distribution is ignored, and the partial width obtained from a measurement of the total rate of a rare top quark process (bW→t), which is proportional to the partial width Γ(t→bW). Measuring the rate of "single top quarks" has an uncertainty far smaller than the experimental error on the more direct measurement of the width.
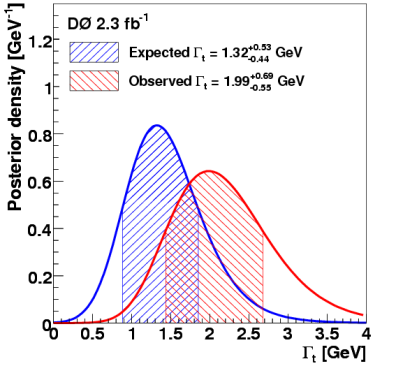
Figure 2: The expected (blue) and observed (red) measurement of the width of the top quark, in GeV. The hatched areas represent 1 standard deviation around the most probable value (the peak).
The result of this technique applied to the DZero data, as seen in Fig. 2, yields a measurement of the width of the top quark of 2.0±0.7 GeV, or a lifetime of (3±1)10-25 s. This is the most precise determination of the top quark lifetime to date.
--Submitted by Assistant Professor of Physics Aran Garcia-Bellido